Query Histogram always empty

Hi,
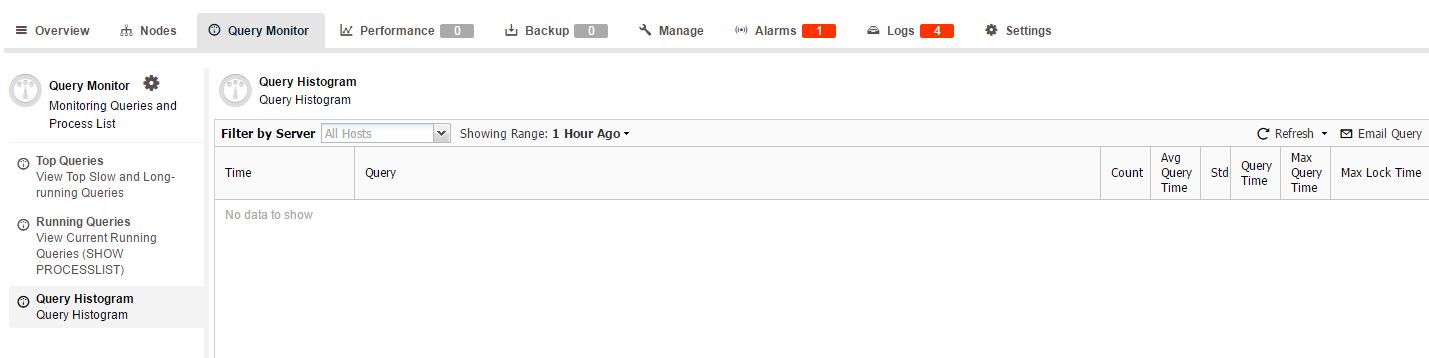
I want to use severalnines to monitor DML and DDL queries. But I found query histogram under query monitor is always empty. How to enable it? Can it be used for monitor DML and DDL queries?
thanks!
queryhistogram.jpg
-

Hi Sam,
You have to enable query sampling at ClusterControl > choose the database cluster > Settings > Query Monitor > Query Sample Time > set it to higher than 1 and also Long Query Time to 0 if you want to monitor them all. If you want to monitor query that is slower than 0.5 seconds, change the Long Query Time accordingly.
Wait for a couple of minutes before the data is populated.
Regards,
Ashraf
-
Hi Ashraf,
Thanks for your reply!
I changed the setting as you mentioned. But still show nothing on query histogram. I tried set the sample time 5 / 15 / 30 and even the highest 60 and wait for a long time to refresh the histogram. Still nothing.
Please find my attached setting screen capture.
Many thanks!
-
Hi Sam,
Did you see the query histogram data being populated now? If not, then please restart cmon service to expedite it. On ClusterControl node:
service cmon restart
Wait for a couple of minutes and you should see some entries there. By the way, what is the Long Query Time you have set? Take note that only the query that executes slower than Long Query Time being captured by ClusterControl. Otherwise, set it to 0 to capture them all.
Regards,
Ashraf
Please sign in to leave a comment.
Comments
3 comments