Interpreting the Status of Galera Cluster for MySQL

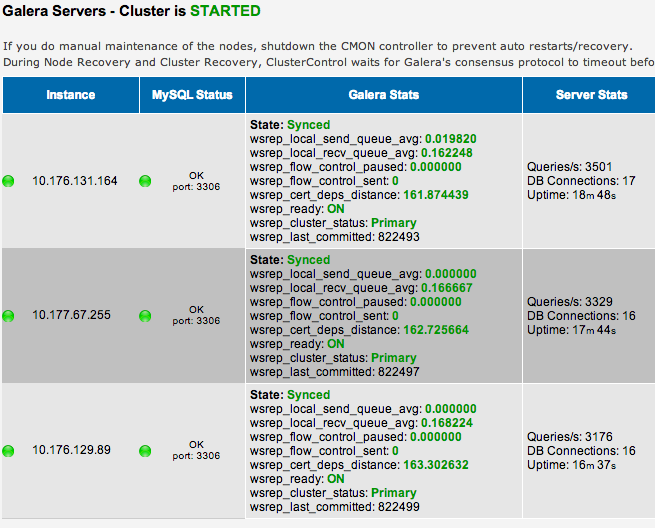
In the main screen, viewing the nodes part of the Galera Cluster, there are few status variables to keep an eye on, in order to find out which is the slowest node or nodes with potential network problems that should be investigated further.
Slowest node
The slowest node in the cluster is the node with the highest values on both:
wsrep_flow_control_sent
wsrep_local_recv_queue_avg
If possible you can:
- add a new node
- drop the slow node
Replication Health
Even though the nodes are in state SYNCED, there may still be sub-optimal replication performance.
Keep an eye on:
wsrep_flow_control_paused
This is the fraction of the time the replication was paused. If the wsrep_flow_control_paused=0.6, e.g, then it has been paused 60% of the time. a value of 1 means that it is not replicating at all (complete stop). It is paused, because it cannot send data to the other nodes. wsrep_flow_control_paused should be as close to 0.0 as possible
In the picture above you can see that wsrep_flow_control_paused=0.00000 and thus it is fine, but if you have (consistently over time, and not just for short random bursts) that wsrep_flow_control_paused is >0.6 (it will show up as RED in that case in the GUI), then you can:
- add a new node
- drop the slow node
- increase wsrep_slave_threads (only set it to >1 if you do NOT have ANY tables without PRIMARY KEYs)
wsrep_cert_deps_distance
indicates how many write sets that could be applied in parallel. This also gives a good indication how to set wsrep_slave_threads. wsrep_slave_threads can be set to wsrep_cert_deps_distance, but it makes no sense to set it more than number of cores you have on the machines.
Sources:
Please sign in to leave a comment.
Comments
0 comments